Forest loss isn’t just an environmental issue – it’s a traceability and compliance risk. With remote sensing, organizations gain verifiable, time-stamped data on where forest degradation is occurring, how fast it’s progressing, and what’s driving it. Whether you’re reporting against EUDR requirements or building a land-use policy framework, satellite imagery and geospatial analysis offer the visibility you need to act with confidence.
Making Forest Loss Visible: How Remote Sensing Changes What We Know
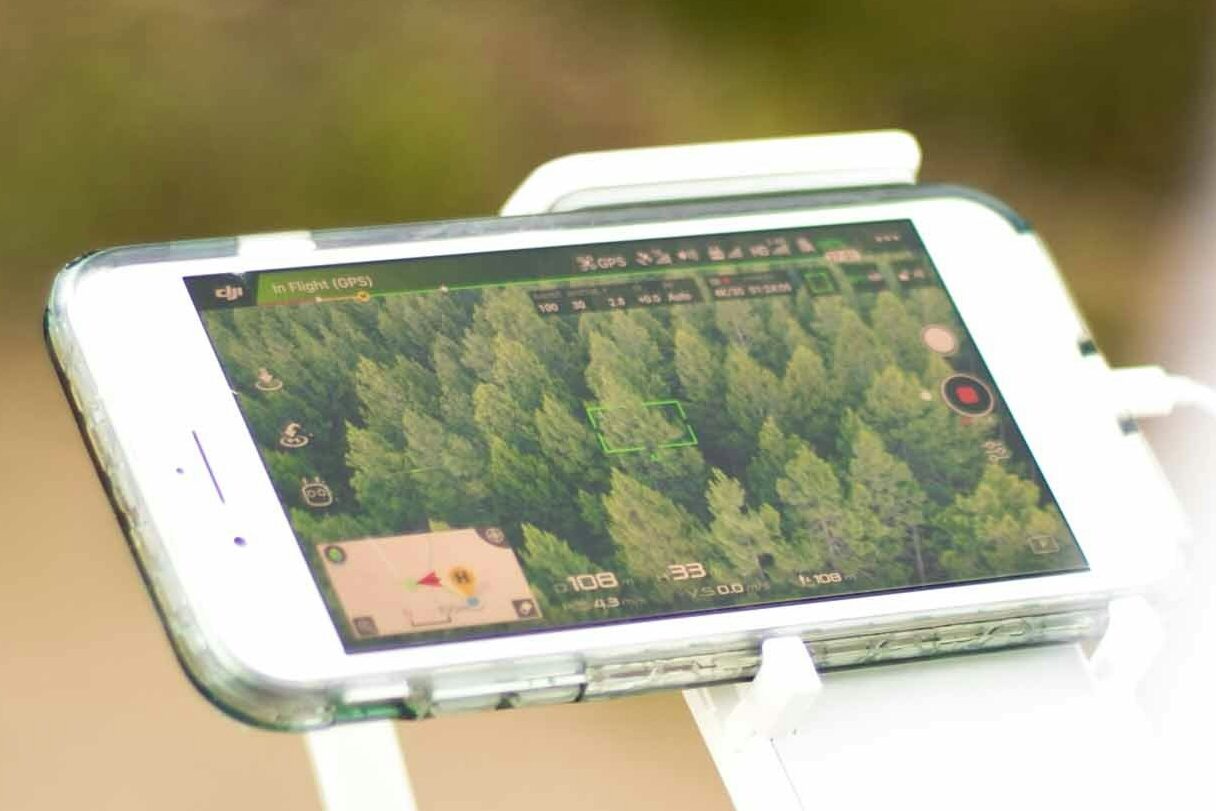
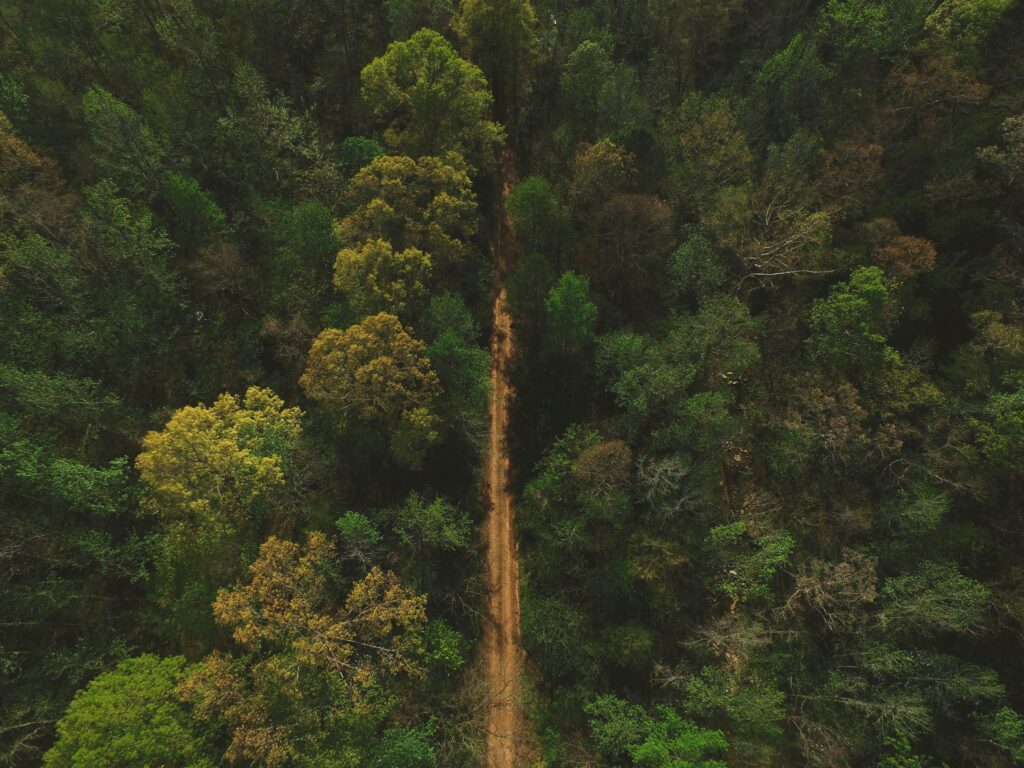
Remote sensing uses satellites, drones, and aerial systems to track land-use change without relying on field teams. Instead of scattered reporting or outdated maps, you’re working with time-stamped, high-resolution data that shows what’s changed, where, and when. Optical imagery highlights vegetation loss. Radar gets through cloud cover. LiDAR adds elevation and structure. Combined, these tools provide consistent visibility across large and remote areas – visibility you can verify.
This kind of monitoring isn’t just useful – it’s becoming necessary. Under regulations like the EUDR, companies have to show that their sourcing hasn’t contributed to deforestation since a fixed cut-off date. That requires clear, geolocated evidence tied to land parcels and supply chain boundaries. Remote sensing connects those dots. And when used proactively, it doesn’t just confirm past clearing – it helps flag pressure zones before forest loss happens, tightening risk management and cutting response time.
What Powers the Data: Technologies Behind Modern Forest Monitoring
Modern forest monitoring runs on more than just good intentions. It’s powered by a growing stack of hardware, sensors, and software – each designed to make land-use change measurable, visible, and verifiable. From legacy satellite programs to AI-driven classification models, here’s a closer look at what actually drives the monitoring process behind today’s deforestation alerts.
1. Satellite Imagery
Satellites are the foundation – without them, there’s no scalable visibility. They capture consistent, repeatable snapshots of forested areas, letting analysts detect change over time without stepping foot on the ground.
Public and commercial sources
Public systems like Landsat (NASA/USGS) and Sentinel (ESA) offer decades of open-access imagery, which is useful for tracking long-term trends. Commercial providers such as Maxar or Planet Labs push for higher resolution and near-daily updates, which helps when timelines are tight or detail is critical.
Optical and radar options
Optical sensors give you the visible spectrum – what most people picture when they think of satellite images. But in cloud-prone regions, SAR (Synthetic Aperture Radar) systems offer a key advantage: they operate regardless of weather or light, giving you uninterrupted monitoring capacity.
2. LiDAR (Light Detection and Ranging)
LiDAR doesn’t replace satellite imagery – it deepens it. While imagery shows surface cover, LiDAR gives structure: canopy height, ground elevation, and vegetation density, all in precise 3D.
High-resolution forest structure
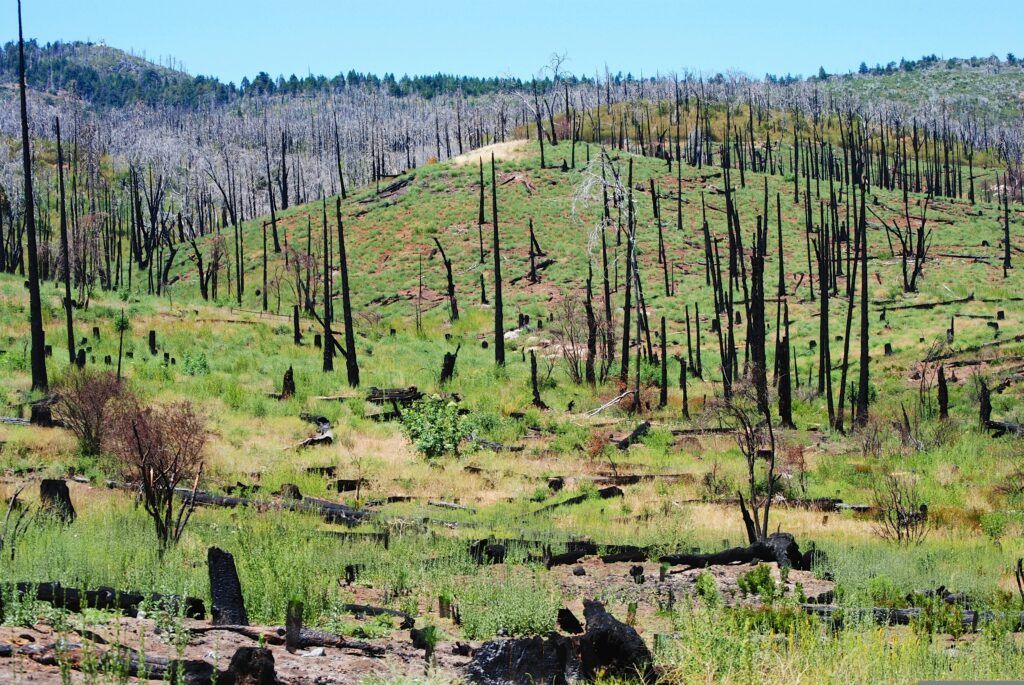
Mounted on aircraft or drones, LiDAR systems fire laser pulses toward the ground and measure how long they take to bounce back. This allows analysts to map biomass, monitor thinning, and assess whether a forest is degraded or intact – critical distinctions for regulation and reporting.
Use cases beyond detection
LiDAR is especially useful when verifying claims. If a supplier says a parcel of land is “secondary forest” or “recovered woodland,” LiDAR data can help confirm or refute that – with metrics, not guesswork.
3. Multispectral and Hyperspectral Sensors
These sensors read light across multiple wavelengths, including ones the human eye can’t detect. They’re mostly used to understand vegetation health and composition.
Detecting subtle changes
Tools like the Normalized Difference Vegetation Index (NDVI) convert raw data into visual insights, flagging areas where plant stress or degradation may be underway – even before deforestation becomes visible from above.
Application in monitoring degradation
In places where clear-cutting isn’t the issue but degradation is – think selective logging or disease – spectral data can be more effective than traditional imagery alone.
4. Machine Learning and Classification Algorithms
The raw data volume is huge. Manually reviewing it? Not realistic. That’s why modern monitoring pipelines lean heavily on automation and classification.
Pattern recognition at scale
Machine learning models – including Random Forests and SVMs – are trained to distinguish between forest, cropland, urban expansion, and more. They can flag anomalies and even estimate the likelihood of illegal land-use changes based on known patterns.
Evolving with the landscape
What’s especially useful: these models can adapt over time. As land use evolves or satellite sensors improve, the algorithms improve with them – making them central to long-term forest surveillance strategies.
5. GIS Platforms
Remote sensing data is valuable, but on its own, it’s raw. GIS platforms turn that data into something usable – something you can act on.
Layering and visualization
Tools like QGIS, ArcGIS, or Google Earth Engine allow users to overlay multiple data types (e.g. imagery, LiDAR, alerts) and extract actionable insights. You’re not just looking at one satellite pass – you’re tracking months or years of change in a single interface.
Decision support and reporting
GIS maps aren’t just visuals. They form the backbone of compliance reporting, environmental audits, and conservation planning. For entities under regulations like EUDR, they’re a source of evidence – not just illustrations.
Monitoring in Action: Tools, Policies, and Practical Use
Data alone doesn’t get you to compliance – it’s what you do with it. Forest monitoring now sits at the intersection of technology, regulation, and operational workflows. From open-source dashboards to private risk engines and regulatory frameworks like the EU Deforestation Regulation, a range of systems are being used to align satellite imagery with sourcing, land classification, and due diligence. What matters most is how these components connect – and whether they’re actually usable at scale.
EUDR
EUDR operates as a dedicated resource for navigating the EU Deforestation Regulation (EUDR). Our work is focused on helping businesses understand the scope of the law, clarify their obligations, and prepare for enforcement deadlines. Much of what we do revolves around documentation, supply chain verification, and land-use traceability – especially for high-risk commodities
We don’t generate satellite data ourselves. Instead, we work across existing datasets and monitoring platforms to support actionable compliance workflows. That includes validating geolocation points against the EUDR cut-off date, flagging exposure to recent deforestation, and helping companies respond to substantiated concerns. If you’re unsure where your exposure stands or what kind of land-use data you’ll need to validate your sourcing, you can always reach out to us at info@eudr.com – we’ll point you in the right direction.
Used For:
- Works across existing satellite and geolocation data
- Supports due diligence documentation and traceability
- Helps interpret regulatory thresholds and cut-off compliance
- Provides guidance on handling substantiated concerns
Starling (Airbus)
Starling is a forest monitoring platform developed by Airbus in collaboration with Earthworm Foundation. It’s designed to support companies in tracking deforestation risk across their supply chains, particularly in the context of regulatory compliance like EUDR and Scope 3 emissions reporting.
The platform relies on imagery from Airbus’ own satellites along with data from Sentinel-2 and Landsat. Starling detects changes in forest cover, links land-use shifts to specific supply chain actors, and generates diagnostics that support traceability. A custom dashboard gives users a consolidated view of verified no-deforestation zones, with alerting features built in. Starling is already in use by major brands working in cocoa, palm oil, and pulp & paper sectors.
Used For:
- Satellite imagery from Airbus, Sentinel-2, and Landsat
- Automated alerts for recent forest cover change
- Dashboard view of no-deforestation verification status
- Supports EUDR alignment and Scope 3 reporting
Restoration Monitoring Tools (WRI)
The Restoration Monitoring Tools Guide, developed by the World Resources Institute (WRI), is more of a directory than a single platform. It helps users evaluate and select tools suited for monitoring forest and land restoration – not just deforestation, but regeneration as well.
The platform includes case studies, technical evaluations, and a searchable ToolFinder to help conservationists, NGOs, and land managers match their monitoring goals with appropriate technology. It’s structured for accessibility, aiming to bridge the gap between on-the-ground restoration projects and the often complex world of geospatial monitoring systems.
Used For:
- ToolFinder to evaluate and compare monitoring platforms
- Focus on forest regeneration and post-deforestation recovery
- Use cases across NGOs, land managers, and governments
- Practical resource for setting up restoration tracking systems
Swift Geospatial
Swift Geospatial provides deforestation monitoring solutions with a strong emphasis on real-time data and high-resolution satellite imagery. Their service is built around GIS integration, and supports use cases ranging from illegal logging detection to biomass estimation.
What sets Swift apart is the operational focus – the tools are designed to support direct interventions, with clear outputs that can be used by enforcement bodies, local governments, or sustainability leads inside companies. Their platform tracks encroachment, land-use change, and forest degradation, especially in sectors like cocoa, palm oil, and timber. The emphasis is on actionable data that informs both compliance and conservation planning.
Used For:
- Real-time satellite monitoring of deforestation hotspots
- GIS dashboards for forest mapping and inventory
- Supports illegal logging detection and land encroachment alerts
- Enables evidence-based reforestation planning
Global Forest Watch (GFW)
Global Forest Watch is a widely used, open-access platform run by the World Resources Institute. It provides global forest monitoring tools with layered, near real-time satellite data – accessible through an interactive map, dashboards, and APIs.
GFW is designed for a broad audience, from policymakers to local communities. It supports deforestation alerts (e.g., GLAD and RADD systems), risk mapping, and custom area monitoring. Many users rely on GFW as a neutral, public resource to assess forest change, report progress, or flag violations. Its open nature makes it a common reference point in sustainability reporting and due diligence processes tied to forest risk.
Used For:
- Near real-time deforestation alerts (GLAD, RADD)
- Free and open-access forest monitoring tools
- Custom area monitoring and API integrations
- Widely used in sustainability reporting and enforcement
How Deforestation Is Detected: Core Methods That Actually Get Used
Most monitoring tools rely on a mix of data sources and techniques to figure out what’s happening on the ground. Below are the ones that show up again and again – not theoretical models, but actual methods that help teams flag, verify, and report forest loss.
Common Techniques in Use:
- Change Detection: Comparing two satellite images taken at different times. If something green turned brown, or dense cover turned sparse, that gets flagged. Works best with multi-temporal data and a clear baseline.
- NDVI and Other Vegetation Indices: NDVI tracks the “greenness” of an area. A drop usually means vegetation loss – forest cleared, burned, or degraded. It doesn’t explain why, but it points to where.
- Supervised and Unsupervised Classification: Classification algorithms label land cover types based on pixel values. With supervised classification, you train the system using known examples (forest, bare land, crops). With unsupervised, the system clusters data without pre-labels.
- SAR (Synthetic Aperture Radar): Radar sensors don’t care about clouds. That’s why SAR is widely used in tropical zones. It detects changes in surface texture and moisture – good for spotting logging activity or clearing in cloudy regions.
- Object-Based Image Analysis (OBIA): Instead of looking at single pixels, OBIA groups them into shapes. Helps avoid false positives by adding spatial context (e.g., natural gaps vs. human-cleared areas).
- Machine Learning Models: Trained on labeled imagery, these models learn what deforestation looks like and can apply that logic at scale. Random Forest and Support Vector Machines are common. Deep learning’s starting to show up more, but requires heavy training data.
- Time-Series Monitoring: Looking at a longer timeline helps separate seasonal changes from real deforestation. Useful when trying to avoid false alarms or to confirm a trend.
- LiDAR: Uses laser pulses to map canopy height and structure. It’s not for daily monitoring but gives solid data for biomass estimates and checking degradation in “still green” forests.
Future Trends in Remote Sensing for Forest Monitoring
The direction of forest monitoring is leaning toward speed, automation, and integration. Satellites with shorter revisit times are making near-real-time tracking more feasible, especially when paired with cloud-based processing. Drones are filling in the gaps where satellite resolution isn’t enough or where on-the-ground validation is required. At the same time, radar and thermal imaging are being layered in to deal with persistent cloud cover or detect non-visible changes like surface moisture and heat. These mixed-sensor systems are getting better at detecting early signs of degradation – not just total forest loss.
On the analytics side, machine learning models are evolving beyond just labeling forest and non-forest. They’re being trained to detect behavior – logging patterns, edge creep, gradual thinning – and link that to risk scoring. That’s starting to influence how companies set sourcing thresholds or trigger internal reviews. We’re also seeing more platforms connect directly into traceability systems, compliance dashboards, and procurement tools. Instead of monitoring being a separate technical step, it’s becoming part of how supply chains operate and how regulatory exposure is managed in practice.
Conclusie
Monitoring deforestation with remote sensing isn’t new – but what’s changed is how directly it now feeds into enforcement, supply chain accountability, and regulatory compliance. What used to be a research tool is now a core part of how organizations track land use, document risk, and respond to pressure from laws like the EUDR. The tech is there, the data is constant, and the expectations are clear. What matters now is how well systems can connect the dots – between imagery, sourcing, and real consequences on the ground.
As requirements tighten and reporting windows shrink, remote sensing will only become more embedded in daily operations. The challenge isn’t access to data – it’s knowing what to do with it, when, and how to tie it back to specific obligations. That’s where the value is: not in the pixels themselves, but in what they make visible, verifiable, and enforceable.
FAQ
1. What exactly is remote sensing in the context of deforestation?
It’s the use of satellite, drone, or aerial data to detect and monitor changes in forest cover. Instead of sending people into the field, you analyze image data over time to spot where and when land use has changed.
2. How can I tell if deforestation has occurred in a specific location?
You compare satellite imagery from different time periods. If dense vegetation becomes bare or thinned out – that’s a signal. Tools like NDVI or direct change detection models help quantify and flag it.
3. Does remote sensing still work in cloudy or high-rainfall areas?
Yes, but you’ll need radar-based systems like SAR. These sensors can see through clouds and are especially useful in tropical regions where optical imagery breaks down.
4. Do I need to set up my own system or buy a subscription?
Not necessarily. Many companies use existing platforms like Global Forest Watch, Starling, or Swift Geospatial. The key is whether those tools can give you what you need to meet documentation and reporting requirements.