Forest loss rarely happens in plain sight. It unfolds across distant regions, in fragmented patches, often too fast for traditional oversight to keep up. That’s where remote sensing steps in. With satellites, drones, and AI-driven analysis, organizations can detect land-use change at scale, flag high-risk zones, and trace sourcing regions – even in areas that are otherwise inaccessible. As the pressure grows to meet new deforestation-free regulations, reliable geospatial data isn’t just helpful – it’s necessary.
How Remote Sensing Works for Forest Monitoring
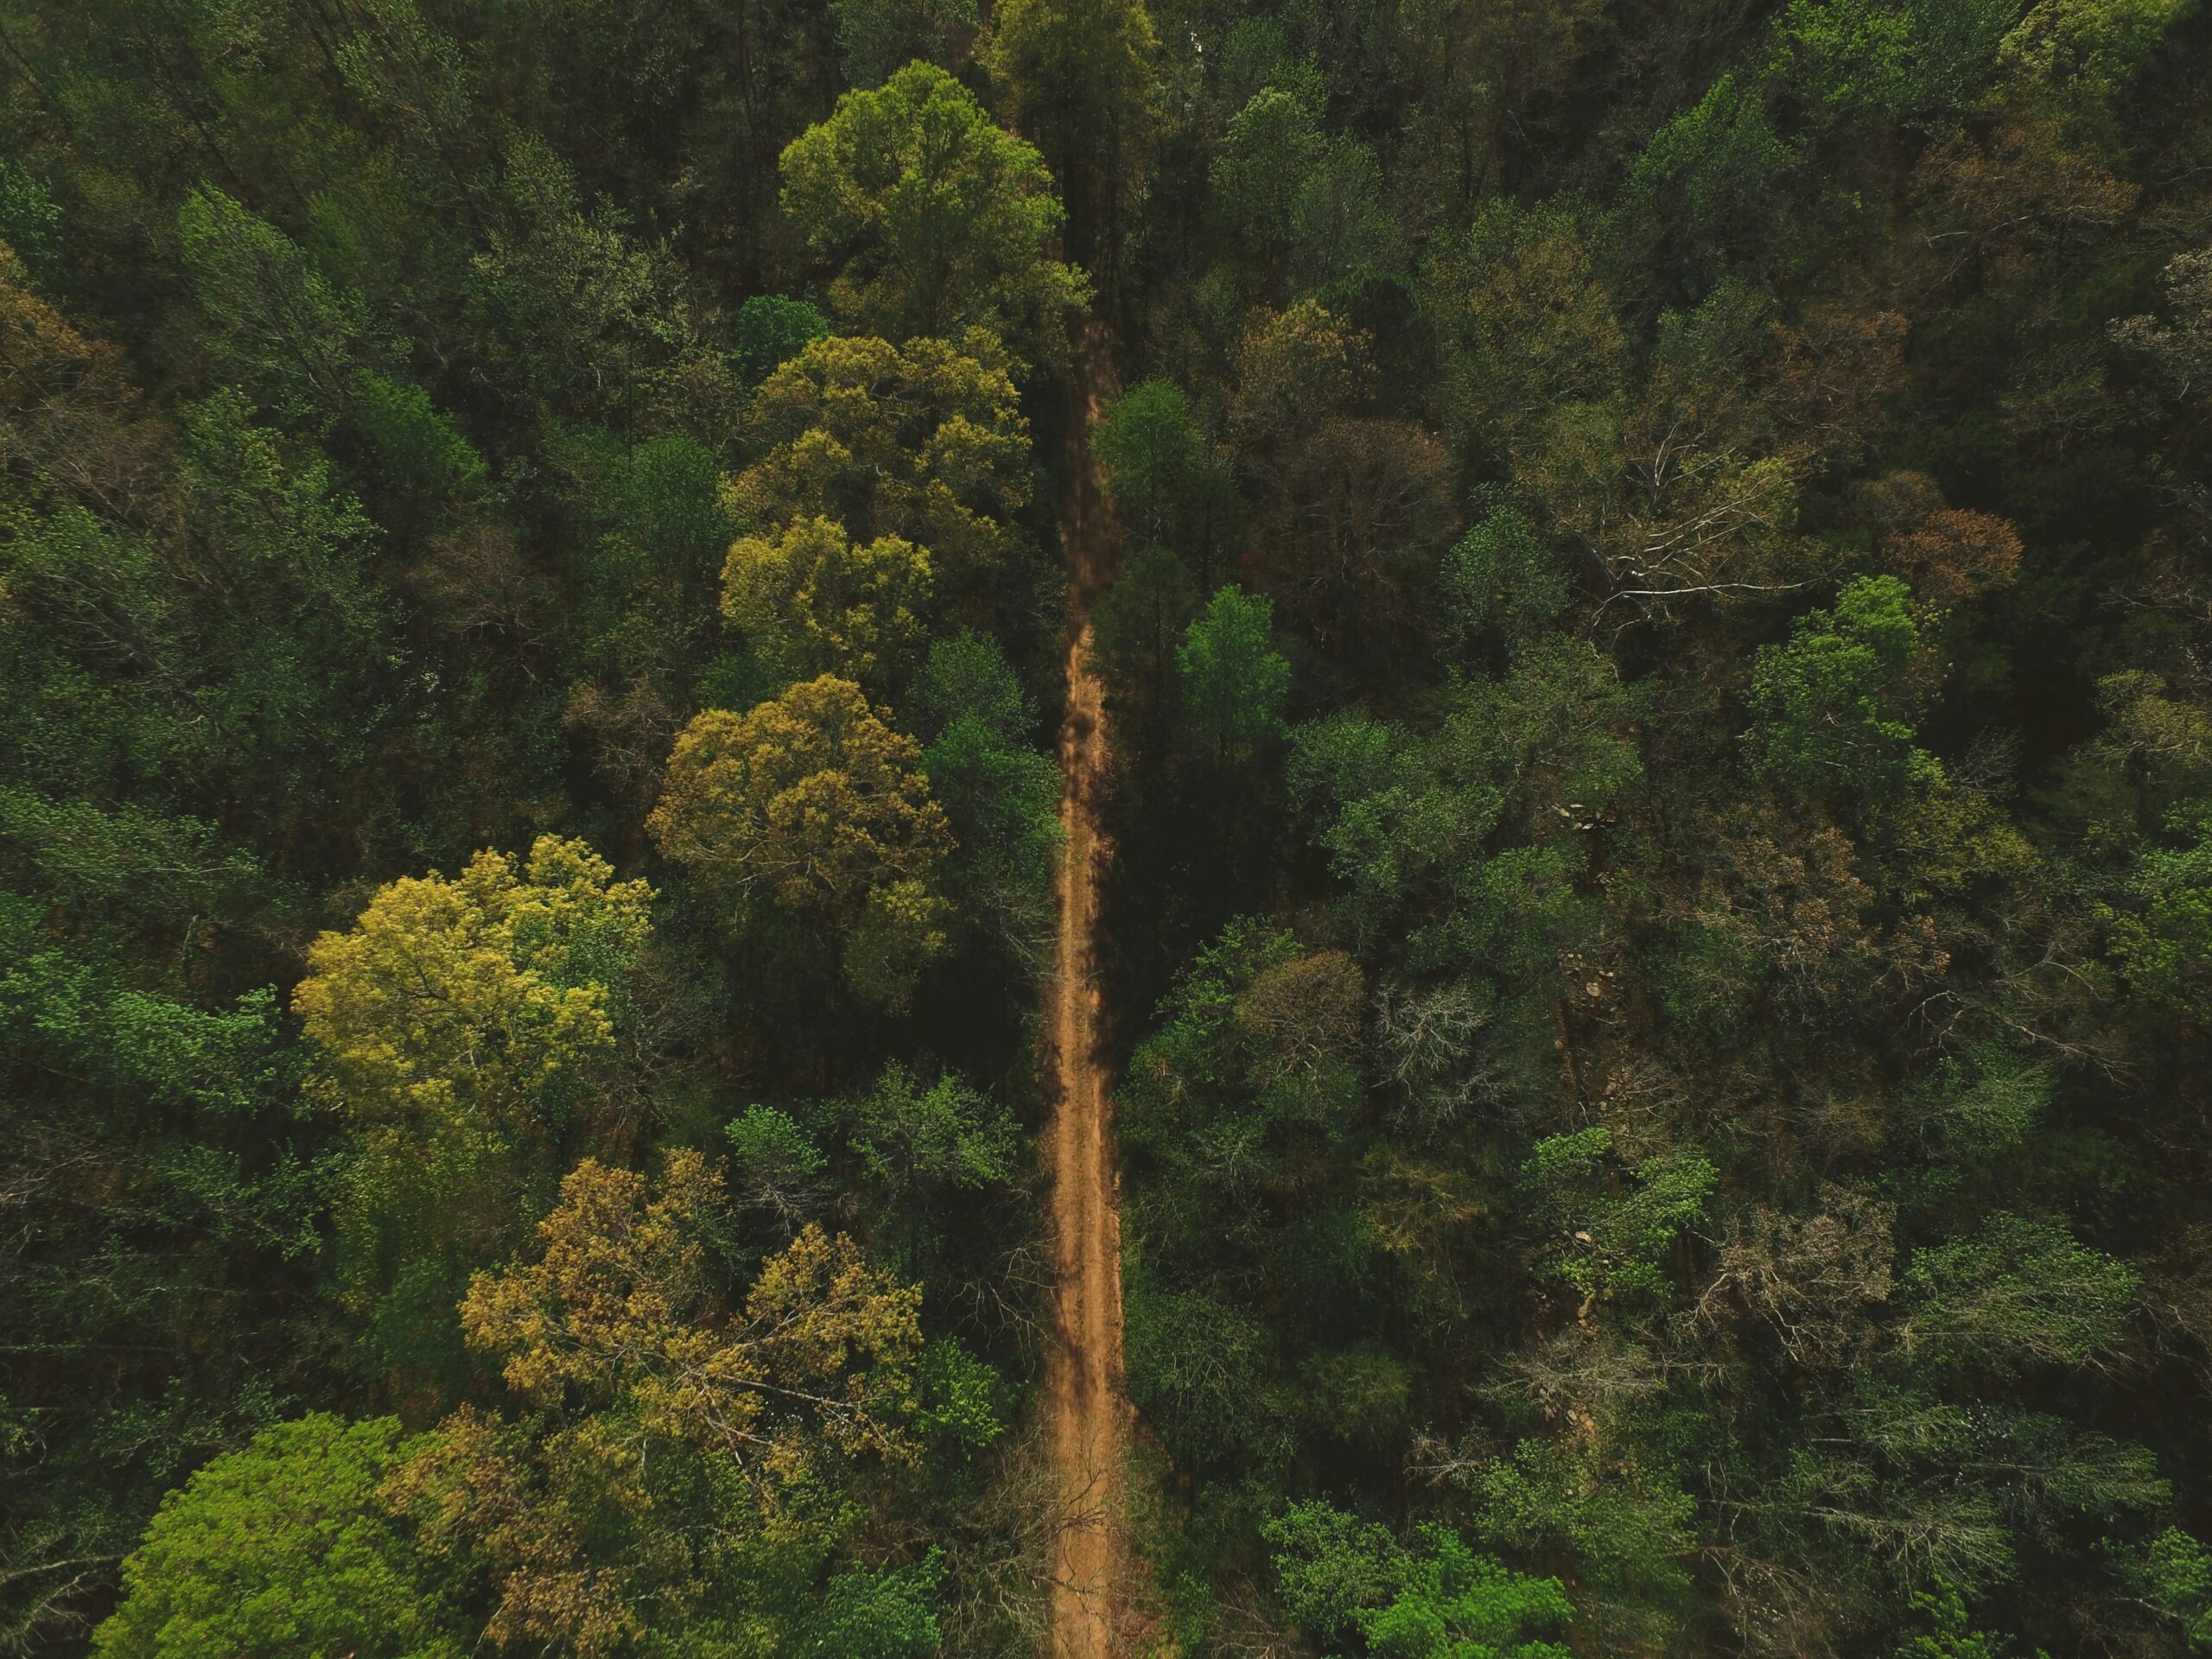
Remote sensing lets us track what’s happening in forests without physically being there – which, for large or hard-to-reach regions, is the only realistic option. Satellites, drones, and aerial sensors capture up-to-date imagery, sometimes daily, and that data gets processed to reveal what’s changed: tree loss, land conversion, road expansion, even signs of illegal logging. Depending on the tech, it might use visible light, radar, or infrared to cut through cloud cover and dense canopy. Tools like Synthetic Aperture Radar (SAR) can detect subtle changes in terrain and biomass, while Lidar builds 3D profiles of tree height and structure. Combined with AI, this information becomes even more useful – helping to flag at-risk zones or confirm whether a sourcing region is still deforestation-free.
What makes this approach practical is its scale and repeatability. You can’t monitor an entire supply chain with field visits alone. But with consistent, georeferenced imagery and structured data, companies can create audit trails, back up their due diligence statements, and respond quickly when land-use changes occur. For regulations like the EU Deforestation Regulation (EUDR), that’s no longer just helpful – it’s part of what’s expected.
The Role of the EU Deforestation Regulation (EUDR)
We’re a team that helps companies move from awareness to actual compliance with the EU Deforestation Regulation. This isn’t just a policy nudge – it fundamentally changes how businesses source, trace, and verify products linked to forest-risk commodities. Under EUDR, companies must be able to prove that their supply chains are deforestation-free, with evidence that can hold up to inspection. That means no assumptions, no vague commitments – just clear data and traceable land-use history.
If your business deals with soy, palm oil, cattle, cocoa, coffee, rubber, or wood (or products made from them), you’re required to meet a new standard of due diligence. And it’s not optional. Here’s what that looks like in practice:
- You need geolocation-linked data for every plot of land in your supply chain
- You must submit due diligence statements before placing products on the EU market
- You have to risk-score and assess each sourcing region
- And you’re expected to retain proof – satellite imagery, reports, and other records – for five years
Our role is to help you bring structure to all of that. We support companies in building traceability workflows, reviewing satellite and remote sensing data, and preparing defensible documentation for audits or inspections. If you’re unsure where to begin or how to apply these rules to your specific operations, just reach out – we’re happy to talk through next steps. You can always contact us directly at info@eudr.com.
Remote Sensing Technologies and Tools: What’s Actually Being Used
There’s a lot of talk about “remote sensing” – but what does it actually involve when you’re trying to monitor deforestation in a way that supports regulatory compliance? It comes down to the right mix of imagery sources, sensors, data processing tools, and sometimes machine learning. Here’s a breakdown of what’s being used in real monitoring workflows, not just theory.
Satellite Imagery Providers
These platforms supply the raw visuals used to detect land-use change. Some offer daily coverage, others specialize in long-term change detection.
- Planet Labs: Known for high-frequency imaging, useful for near real-time forest monitoring and carbon tracking
- Maxar: Offers very high-resolution images and a change detection feature called Persistent Change Monitoring (PCM)
- NICFI (via Planet): Provides free access to deforestation mosaics for key tropical regions
- Sentinel & Landsat: Long-standing public datasets used for baseline comparisons and trend analysis
Sensor Types and Capabilities
Each sensor sees the landscape differently. Combining them helps create a more accurate picture.
- Optical sensors: Capture visible and near-infrared light; good for assessing vegetation health and canopy cover
- Synthetic Aperture Radar (SAR): Penetrates clouds and vegetation; reliable in cloudy or rainy regions
- Lidar: Uses lasers to create 3D maps of forest height and structure
- Thermal sensors: Detect temperature variations; less common but useful in specific environmental conditions
Processing & Analysis Tools
After the images come in, they need to be tiled, analyzed, and interpreted. This is where the heavy lifting happens.
- Google Earth Engine: Cloud-based processing of large geospatial datasets
- QGIS: Open-source GIS platform often used to review outputs and export visuals
- Telluric: A Python-based tool that simplifies tiling, geojson handling, and integration with classifiers
- Custom ML models: Like ResNet50 classifiers trained to tag land use (e.g., forest, agriculture, roads)
AI and Machine Learning Models
When human review isn’t scalable, trained classifiers can detect patterns and flag suspicious changes automatically. One example is the approach taken by Digital Sense, who used open data and a ResNet-based classifier to tag land as forest, agriculture, or habitation, and track changes over time – even highlighting false positives caused by cloud shadows or image oversaturation.
Platforms Helping Monitor Deforestation Today
When it comes to verifying deforestation-free sourcing or building an auditable compliance trail, the tools you use matter. Below are some of the platforms currently playing a role in how organizations detect forest loss, trace land-use changes, and support EUDR-aligned due diligence. Each one brings something different to the table – from daily satellite updates to AI-powered land classification.
1. Planet Labs
Planet operates one of the largest commercial satellite constellations, capturing daily imagery at resolutions that make it possible to monitor forest cover in near real time. Their Forest Carbon Monitoring solution adds layers like canopy height and aboveground carbon, which can be useful for validating claims in carbon credit projects. For companies needing recurring updates on specific sourcing areas, Planet’s tools are a strong fit – but usually work best when paired with internal GIS workflows or external analytics support.
2. Digital Sense (Custom ML for Forest Monitoring)
Digital Sense brings a slightly different approach by developing custom classifiers trained on open satellite data. Using platforms like Planet’s NICFI mosaics, they’ve built machine learning pipelines that tag land cover (forest, agriculture, habitation, etc.) and detect changes across timeframes. Their process highlights both the strengths and limitations of using AI – including how to spot false positives and refine your models to reduce errors. It’s more technical, but ideal for teams working on high-accuracy compliance monitoring.
3. Swift Geospatial
Swift Geospatial offers a more tailored service for clients needing GIS-integrated forest monitoring. They combine satellite imagery with environmental analysis to detect illegal logging, track vegetation loss, and assess restoration projects. Their tools are often used by government agencies and conservation groups, but they’re increasingly being pulled into supply chain compliance work. Swift is a good option if you need customized reporting and don’t have the in-house resources to manage the data pipeline yourself.
4. Maxar Technologies
Maxar focuses on ultra-high-resolution satellite imagery and has a specific offering called Persistent Change Monitoring (PCM), which helps track gradual or permanent land-use changes. PCM can isolate deforestation activity by removing seasonal or weather-related noise. It’s a valuable tool for long-term sourcing assessments, especially when trying to establish a visual baseline or demonstrate that forest cover hasn’t changed over time.
5. Global Forest Watch (GFW)
GFW is one of the most widely used open platforms for forest monitoring. It aggregates multiple datasets – including GLAD alerts, RADD radar updates, and tree cover loss data – and presents them through intuitive maps and dashboards. GFW isn’t built specifically for EUDR, but many teams use it as a risk screening tool or to review historical forest changes in specific regions. It’s also a helpful place to spot early signs of illegal logging or land conversion.
Why Open Data and Collaboration Are Essential
No single company, platform, or government can monitor global deforestation alone – the scale’s just too big. What makes real progress possible is open access to satellite data and shared infrastructure that allows everyone, from compliance teams to NGOs, to work from the same source of truth. Programs like NICFI, which provide free imagery for tropical forest regions, are a critical part of that. So are platforms like Global Forest Watch, which turn raw data into usable insights without paywalls or locked ecosystems.
Open data only works, though, when it’s paired with collaboration – between suppliers, buyers, regulators, and service providers. Whether you’re building a monitoring system from scratch or trying to integrate new compliance requirements into your existing setup, the ability to align tools, share formats, and build off common standards is what makes deforestation monitoring scalable, not just possible.

Where Remote Sensing Still Falls Short
Remote sensing has transformed how we monitor forest change – but it’s not flawless. If you’re using it to support compliance, especially under EUDR, you need to understand where the gaps are and how to work around them. Here are some of the main limitations teams run into:
- Cloud cover and atmospheric noise: Optical satellite imagery can be blocked or distorted by clouds, haze, or smoke. This makes consistent monitoring in tropical regions harder unless you’re using radar-based sensors like SAR.
- False positives from shadows or image quality issues: Poor lighting, oversaturation, or changes in seasonal vegetation can confuse classifiers. Some areas flagged as deforested might just be shadowed, flooded, or newly replanted.
- Lack of ground-truth validation: Most models rely on visual patterns, not field data. Without on-the-ground checks, it’s difficult to confirm what’s actually happening in a specific location.
- Data inconsistency across sources: Resolution, color balance, and band availability vary between providers. That makes it harder to stitch together a clear historical timeline or train machine learning models consistently.
- Limited coverage in non-tropical zones: A lot of open forest data focuses on tropical regions. If your sourcing extends to boreal or temperate forests, your monitoring options may be more limited – or entirely private.
Understanding these weaknesses doesn’t make the tech less useful – it makes your use of it more realistic. The key is knowing where your data holds up, and where you might need to supplement it with other tools or validation methods.
Conclusie
Remote sensing isn’t just another layer of data – it’s become a foundational tool for monitoring land-use change in real time and at scale. Whether you’re responding to EUDR requirements or building your own traceability system, having timely, geo-referenced imagery changes what’s possible.
You’re no longer stuck relying on fragmented reporting or outdated assumptions. Instead, you can see the impact – or the risk – as it happens. But technology alone isn’t the solution. It still takes structure, judgment, and coordination across teams to make that data useful. That’s where compliance meets real-world strategy. And if you need support putting those pieces together, we’re here to help.
FAQ
1. What’s the difference between optical and radar imagery for deforestation monitoring?
Optical sensors rely on visible and near-infrared light, so they’re great for assessing canopy cover – but they can be blocked by clouds. Radar (like SAR) uses microwave signals that cut through cloud cover and vegetation, making it more reliable in cloudy or humid regions.
2. Can remote sensing data be used directly in an EUDR due diligence statement?
Yes, as long as the data is geo-referenced and clearly linked to sourcing areas. Satellite imagery, change detection reports, and time-stamped maps can all serve as supporting evidence for land-use history.
3. Do I need to monitor deforestation in real time?
Not necessarily, but having a regular cadence – monthly or quarterly, depending on risk level – can help flag issues early. Some platforms offer near real-time alerts, which are especially useful for high-risk sourcing zones.
4. How accurate are AI-based deforestation classifiers?
It depends on the quality of the training data and how well the model is tuned to local conditions. False positives and misclassifications can happen, especially when image quality is low or seasonal changes mimic land clearing.
5. What if the satellite data shows possible deforestation, but we’ve confirmed it’s not?
That’s where documentation and context matter. If you can provide ground-truth validation or explain natural changes (like seasonal flooding), you can address alerts without triggering compliance issues.